Last month, on the first Vienna Solaris Technical Day, I had the opportunity to make a small presentation about a simple method for drawing nice graphs from Solaris performance metrics. As several people asked me for the details, I will share them here.
The concept is simple, just use the Solaris command line utilities, like iostat and send the reformatted output to the popular open source tool Graphite.
What is Graphite?
Graphite is an open source RRDtool-like framework with a large community. It consists basically of 3 components: “Carbon” a server daemon which receives metrics over the network and reads and writes the data from and to a database. The database is called “Whisper”, and is very similar to the famous RRDTool. The third component is the front-end called “Graphite-web”, a Django application which connects to “Carbon” and generates live and on-demand graphs for the collected metrics. Additionally the framework comes with many smart tricks, like caching and auto-configuration. For example you don’t need to create the databases before sending new metrics, the database files will be generated during receiving the first new metric.
The carbon server received the monitoring data in to following form:
test.item value unix_timestamp
How does it work?
The following example demonstrates how to get nice graphs out of the Solaris 11 “zonestat” utility.
First you need a graphite-server. It’s a python application and therefore runs on many operating systems, just google for an install guide for your preferred operating system.
A very simple monitoring client based on the netcat utility looks like the following:
echo "test.item 5 `date +%s`"| netcat <carbon-server> 2003
Now lets find a way to bring the zonestat output into this form.
If you run the tool without special switches you get the human readable form:
$ zonestat 10
Collecting data for first interval...
Interval: 1, Duration: 0:00:10
SUMMARY                   Cpus/Online: 4/4   PhysMem: 3090M  VirtMem: 4114M
                    ---CPU----  --PhysMem-- --VirtMem-- --PhysNet--
               ZONE  USED %PART  USED %USED  USED %USED PBYTE %PUSE
            [total]  0.23 5.89%  904M 29.2% 1379M 33.5%  2706 0.00%
           [system]  0.19 4.86%  512M 16.5%  943M 22.9%     -     -
             global  0.03 0.99%  254M 8.23%  292M 7.11%  2706 0.00%
              zone1  0.00 0.01% 40.9M 1.32% 42.6M 1.03%     0 0.00%
              zone2  0.00 0.01% 48.5M 1.57% 50.3M 1.22%     0 0.00%
              zone3  0.00 0.01% 47.7M 1.54% 50.3M 1.22%     0 0.00%
This output can be parsed, but to make life easier look out for a more simple parseable output. More and more Solaris tools ship with this feature, also zonestat.
$ zonestat -T u -p -P system,zones,total 10
1371068354:interval:summary:[total]:0.19:4.92%:-:-:926533K:29.27%:-:1413053K:33.53%:-:3408:0.00%
1371068354:interval:summary:[system]:0.16:4.15%:-:-:525301K:16.59%:-:966341K:22.93%:-:-:-
1371068354:interval:summary:global:0.02:0.73%:-:-:260701K:8.23%:-:299920K:7.11%:-:2953:0.00%
1371068354:interval:summary:zone1:0.00:0.01%:0.10%:-:41885K:1.32%:-:43724K:1.03%:-:455:0.00%
1371068354:interval:summary:zone2:0.00:0.01%:0.08%:-:49745K:1.57%:-:51540K:1.22%:-:0:0.00%
1371068354:interval:summary:zone3:0.00:0.01%:0.08%:-:48901K:1.54%:-:51528K:1.22%:-:0:0.00%
This output is now a lot easier to parse.
Now you can write a script with your preferred language like f_zonestat.py to reformat the output.
For example:
$ zonestat -T u -p -P system,zones,total 10 | python f_zonestat.py
DEMO.sol11demo1.zonestat.total.cpu.used 0.31 1371068626
DEMO.sol11demo1.zonestat.total.cpu.%used 7.78 1371068626
DEMO.sol11demo1.zonestat.total.PhysMem.used 910.33 1371068626
DEMO.sol11demo1.zonestat.total.PhysMem.%used 29.45 1371068626
DEMO.sol11demo1.zonestat.total.VirtMem.used 1388.12 1371068626
DEMO.sol11demo1.zonestat.total.VirtMem.%used 33.73 1371068626
DEMO.sol11demo1.zonestat.total.PhysNet.used 0.00 1371068626
DEMO.sol11demo1.zonestat.total.PhysNet.%used 0.00 1371068626
...
You can pipe this output now to netcat or send the data directly within the script. In the f_zonestat.py script you can set the CARBON_SERVER variable and “DEBUG_LOCAL=False” to enable this.
Now you should have the information from zonestat available in the web-interface.
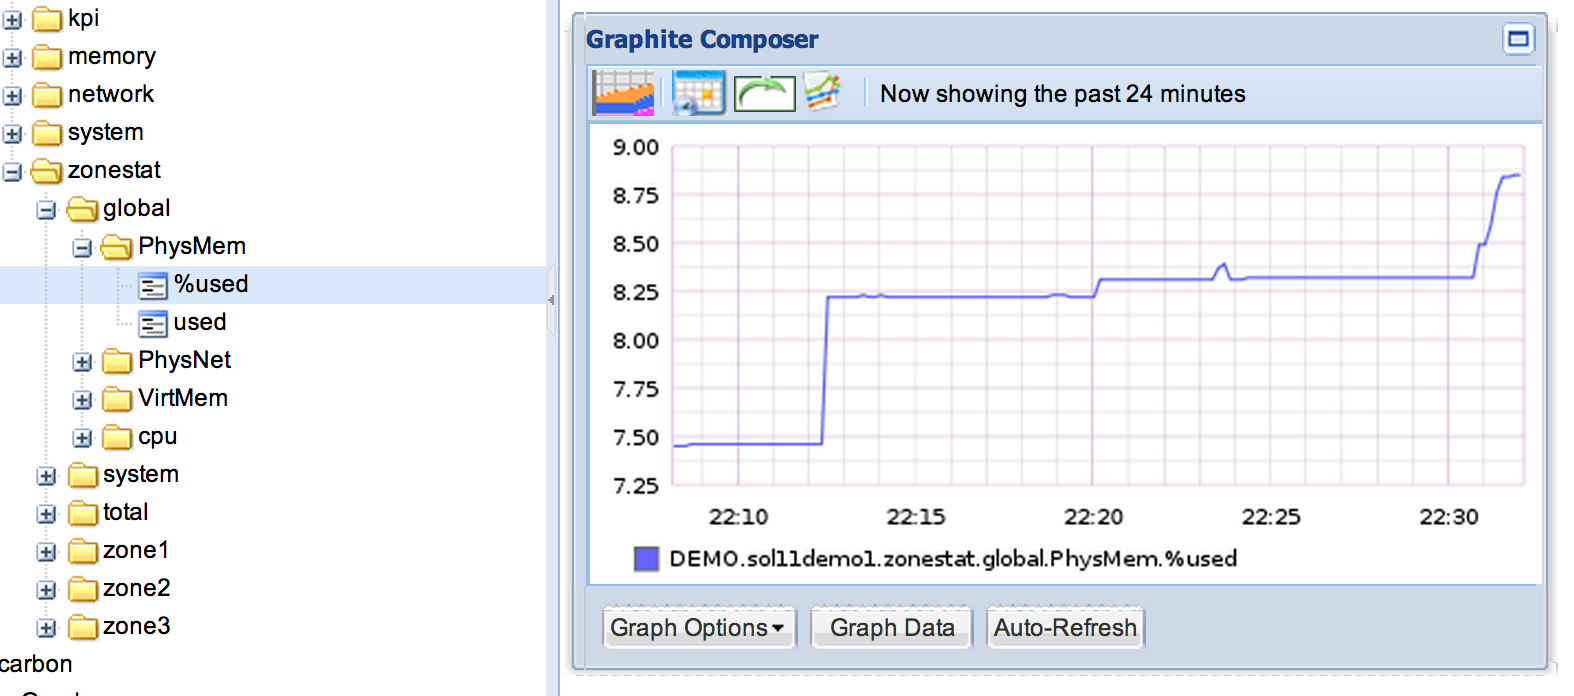
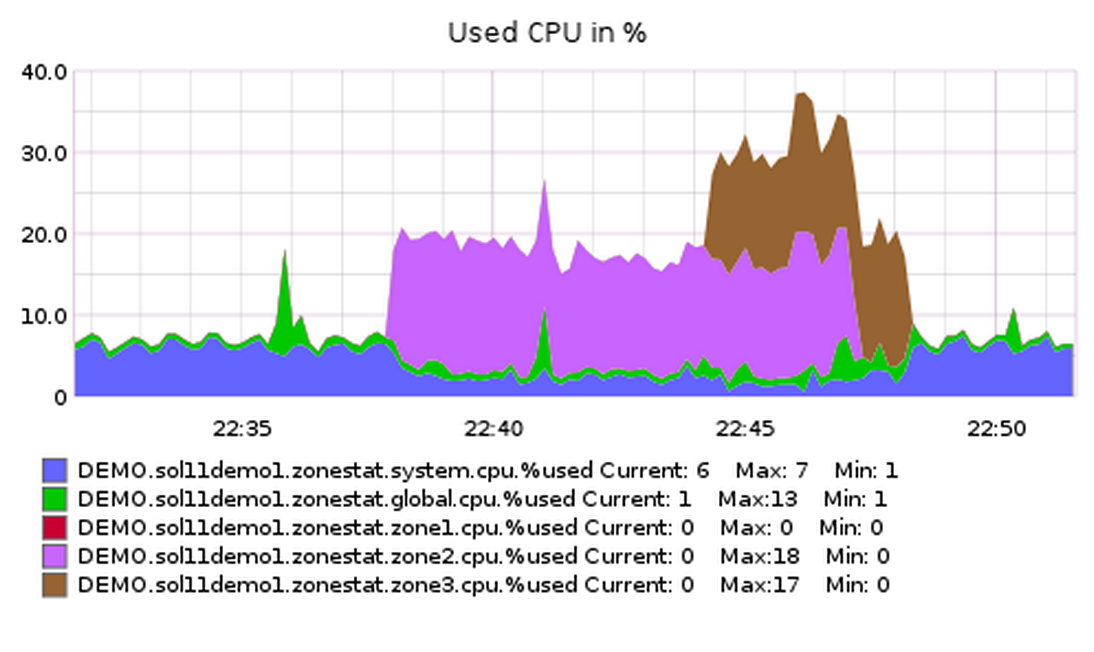
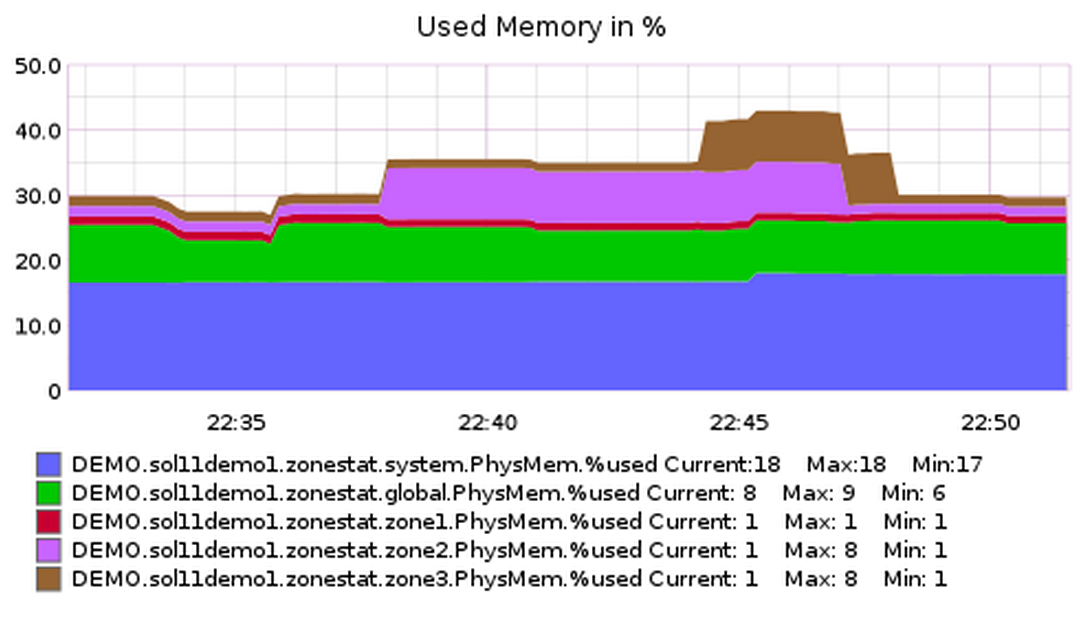
And you can build dashboards like the following:
Source: f_zonestat.py